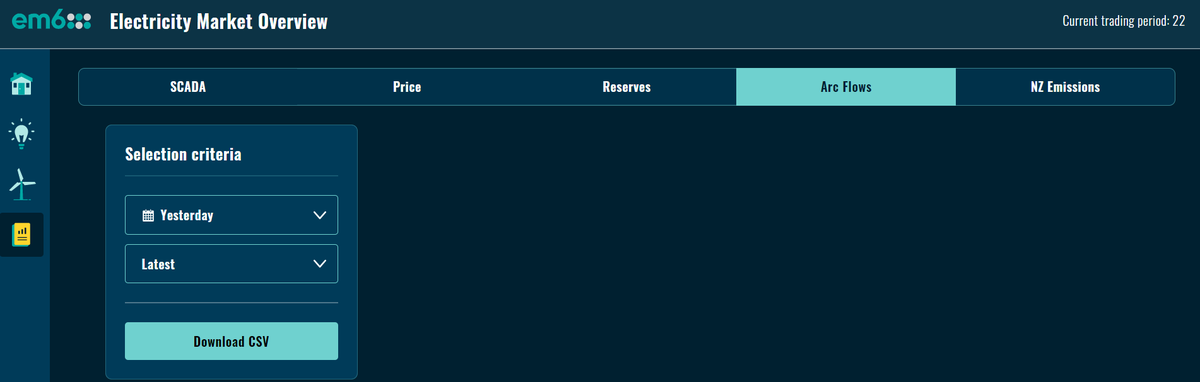
Tucked away near the end of the selection bar on the Reports page within em6 lies the Arc Flows download menu. Selecting the default criteria drops a CSV with almost 80 thousand lines.
Arc Flow reports give detailed data on the movement of power through various parts of the grid. By using this data, power flow patterns can be analysed which can help understand how outages and constraints may affect power transmission.
Looking closer at the report, Arc ID column identifies the part of the grid in question, for example ALB_HEN3.1 refers to the line between Albany and Henderson nodes. The flow in and out at each end is listed for each trading period on the trading date requested, as is the maximum power capacity for the arc.
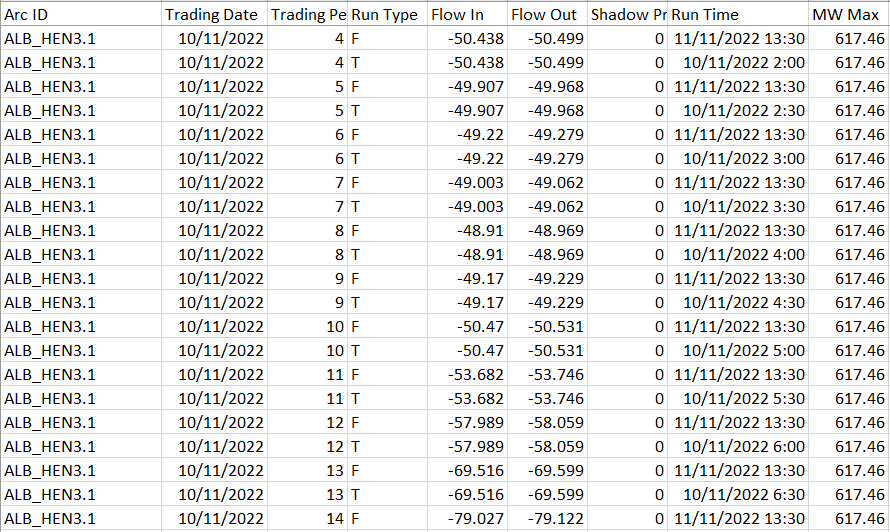
There are 821 different arcs for which data is available, and users can choose final, interim or just the latest run types. Data for provisional run types is available for pre-1 November 2022 dates only.
Find out more about subscribing to Arc Flow reports or connecting to our Arc Flow API feed by emailing call@ems.co.nz.