Access and monitor New Zealand’s energy in real time
em6 is New Zealand’s electricity data hub - an essential information exchange that provides flexible access to electricity market data.

18 Mar
12.66
19 Mar
14.44
20 Mar
15.55
21 Mar
12.85
22 Mar
13.18
23 Mar
14.53
24 Mar
14.67
25 Mar
15.09
26 Mar
14.52
27 Mar
14.51
28 Mar
14.52
29 Mar
14.34
30 Mar
15.88
31 Mar
15.89
18 Mar
10.64
19 Mar
10.59
20 Mar
10.67
21 Mar
10.69
22 Mar
10.76
23 Mar
10.95
24 Mar
11.17
25 Mar
11.46
26 Mar
11.63
27 Mar
11.86
28 Mar
12.01
29 Mar
12.11
30 Mar
12.20
31 Mar
12.51
18 Mar
8.84
19 Mar
8.84
20 Mar
8.88
21 Mar
8.90
22 Mar
8.93
23 Mar
8.97
24 Mar
9.03
25 Mar
9.07
26 Mar
9.13
27 Mar
9.20
28 Mar
9.27
29 Mar
9.32
30 Mar
9.35
31 Mar
9.40
18 Mar
9,880
19 Mar
3,680
20 Mar
4,850
21 Mar
10,360
22 Mar
11,025
23 Mar
9,750
24 Mar
11,180
25 Mar
7,950
26 Mar
13,710
27 Mar
21,450
28 Mar
21,030
29 Mar
16,685
30 Mar
5,200
31 Mar
7,060
Apr 26
4.11
May 26
1.59
Jun 26
1.90
Jul 26
10.08
Aug 26
7.68
Sep 26
3.92
Oct 26
3.78
Nov 26
2.92
Dec 26
5.60
Jan 27
6.01
Feb 27
32.90
Mar 27
16.27
Apr 27
6.53
May 27
7.35
17 Mar
182.81
18 Mar
207.29
19 Mar
191.01
20 Mar
197.41
21 Mar
194.02
22 Mar
185.79
23 Mar
157.82
24 Mar
182.91
25 Mar
202.90
26 Mar
171.25
27 Mar
164.92
28 Mar
153.80
29 Mar
166.31
30 Mar
154.22
17 Mar
196.29
18 Mar
224.22
19 Mar
201.19
20 Mar
206.10
21 Mar
196.47
22 Mar
186.40
23 Mar
165.43
24 Mar
190.14
25 Mar
210.34
26 Mar
185.88
27 Mar
173.08
28 Mar
157.61
29 Mar
168.08
30 Mar
158.84
17 Mar
176.00
18 Mar
201.24
19 Mar
187.20
20 Mar
192.67
21 Mar
190.41
22 Mar
182.04
23 Mar
154.07
24 Mar
178.44
25 Mar
197.89
26 Mar
167.89
27 Mar
163.18
28 Mar
153.69
29 Mar
165.27
30 Mar
152.66
18 Mar
221.0
19 Mar
222.1
20 Mar
221.2
21 Mar
201.9
22 Mar
198.4
23 Mar
216.9
24 Mar
219.6
25 Mar
222.0
26 Mar
225.8
27 Mar
218.0
28 Mar
197.4
29 Mar
194.6
30 Mar
213.6
31 Mar
216.2
19 Mar
600
20 Mar
250
21 Mar
0
22 Mar
0
23 Mar
250
24 Mar
287
25 Mar
364
26 Mar
150
27 Mar
100
28 Mar
0
29 Mar
0
30 Mar
500
31 Mar
1144
01 Apr
0
18 Mar
0.00
19 Mar
0.00
20 Mar
0.00
21 Mar
0.00
22 Mar
0.00
23 Mar
0.00
24 Mar
0.00
25 Mar
0.00
26 Mar
0.00
27 Mar
0.00
28 Mar
0.00
29 Mar
0.00
30 Mar
0.00
31 Mar
0.00
18 Mar
44.15
19 Mar
44.16
20 Mar
43.88
21 Mar
43.91
22 Mar
44.05
23 Mar
43.92
24 Mar
43.85
25 Mar
43.78
26 Mar
43.72
27 Mar
43.50
28 Mar
43.45
29 Mar
43.24
30 Mar
43.11
31 Mar
43.09
18 Mar
39.48
19 Mar
39.49
20 Mar
39.50
21 Mar
39.50
22 Mar
39.50
23 Mar
39.52
24 Mar
39.53
25 Mar
39.53
26 Mar
39.54
27 Mar
39.56
28 Mar
39.56
29 Mar
39.56
30 Mar
39.57
31 Mar
39.57
19 Mar
83.71
20 Mar
82.95
21 Mar
83.37
22 Mar
95.19
23 Mar
98.24
24 Mar
96.18
25 Mar
93.13
26 Mar
77.12
27 Mar
69.29
28 Mar
62.56
29 Mar
71.23
30 Mar
82.44
31 Mar
73.21
01 Apr
111.50
19 Mar
89.42
20 Mar
90.03
21 Mar
90.34
22 Mar
88.80
23 Mar
88.16
24 Mar
88.61
25 Mar
87.81
26 Mar
88.95
27 Mar
89.71
28 Mar
90.70
29 Mar
89.09
30 Mar
88.47
31 Mar
88.76
01 Apr
82.23
We provide electricity industry data in a range of flexible packages and rates, to support your business activities when and where you need it.
Free data and visuals
Free dashboard showing real time price and generation data
- Latest market prices
- Carbon emissions indicators
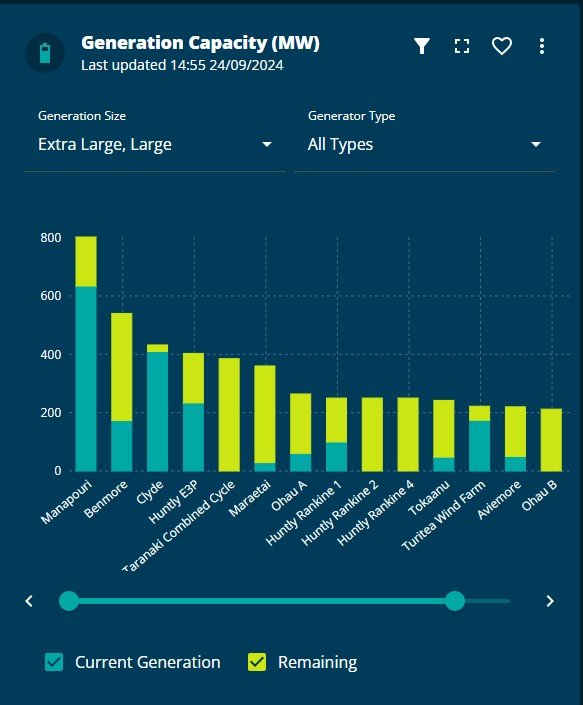
- Generation summary and load data at node level
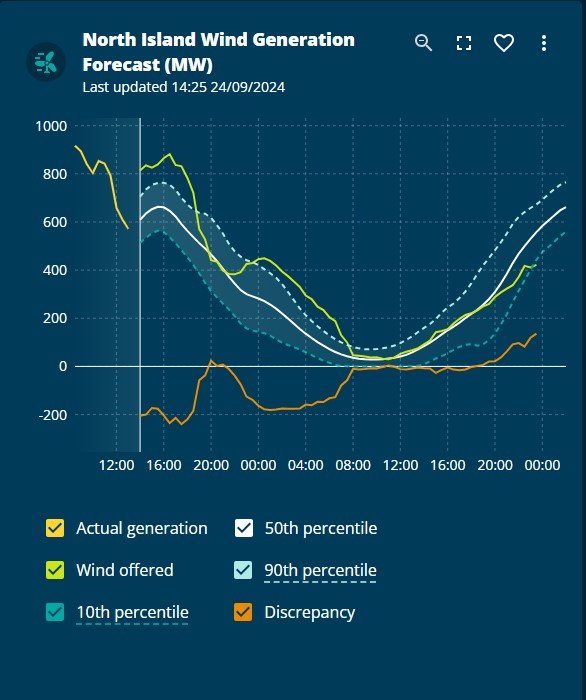
- North Island Wind Generation forecast widget
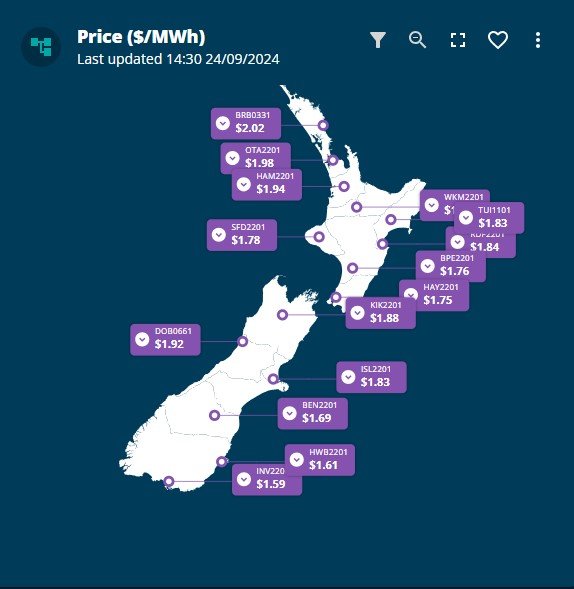
Latest market price and forecast information
- Current wholesale electricity prices around the country
- Graphs displaying recent price fluctuations
- Price trends and forecasts for previous, current and future trading periods
- Downloadable reports for all pricing schedules at any nationwide price node
- API feeds to tap into for your own use
Wide range of load and generation data
Incredible range of load generation data across the grid, available via downloadable CSV reports, API feeds or displayed on our dashboards.
- Real-time minute by minute SCADA load data
- Load predictions graph showing movements in system operator forecasting
- Generation Capacity with real time snapshot of each generator's activity around the country
- Thirty-minute HVDC flow data
- Residuals data for New Zealand and by island, for different schedules
- RCPD and yearly peaks information
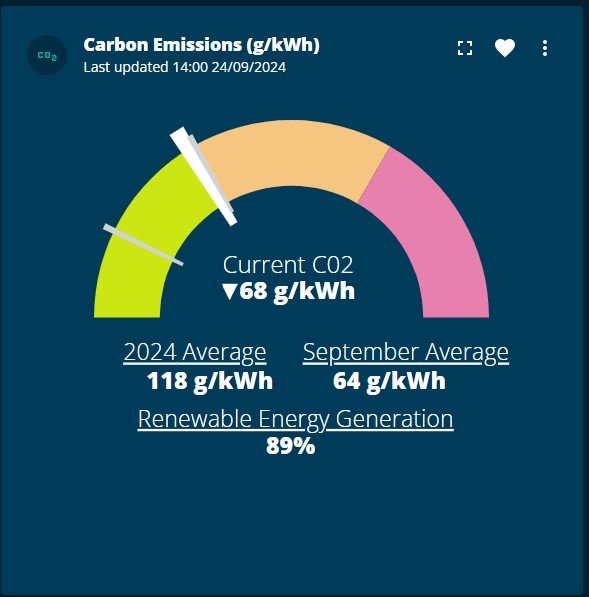
Half-hourly carbon emissions data
We produce our own half-hourly emissions data feed based on generation data and carbon intensity factors for each power generator supplying the national grid.
- Underlying data and carbon intensity methodology verified by Toitū Envirocare for use by companies reporting their emissions
- Free current carbon intensity indicator, renewable energy generation percentage, and API feed
- Historic carbon intensity emissions data API feed