Real time market and energy data, presented in widgets: understandable, insightful graphs and charts
Free, live market information
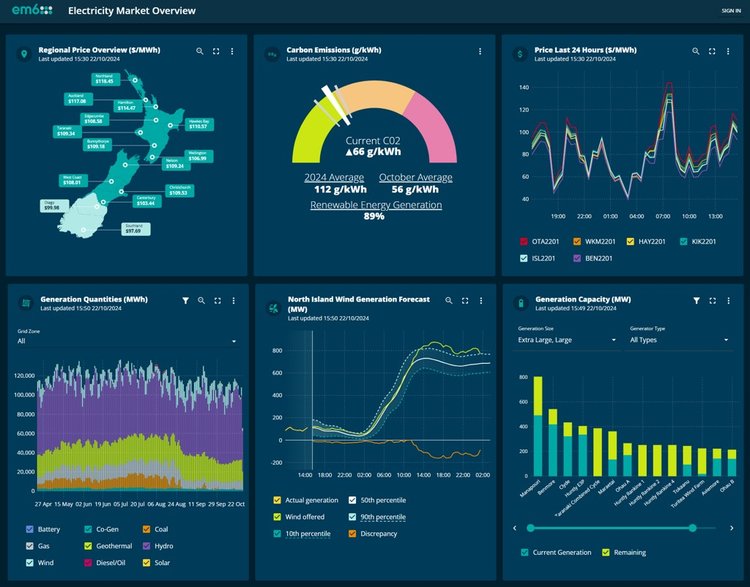
Free for everyone, a national energy situation dashboard with five widgets showing:
- Regional spot prices
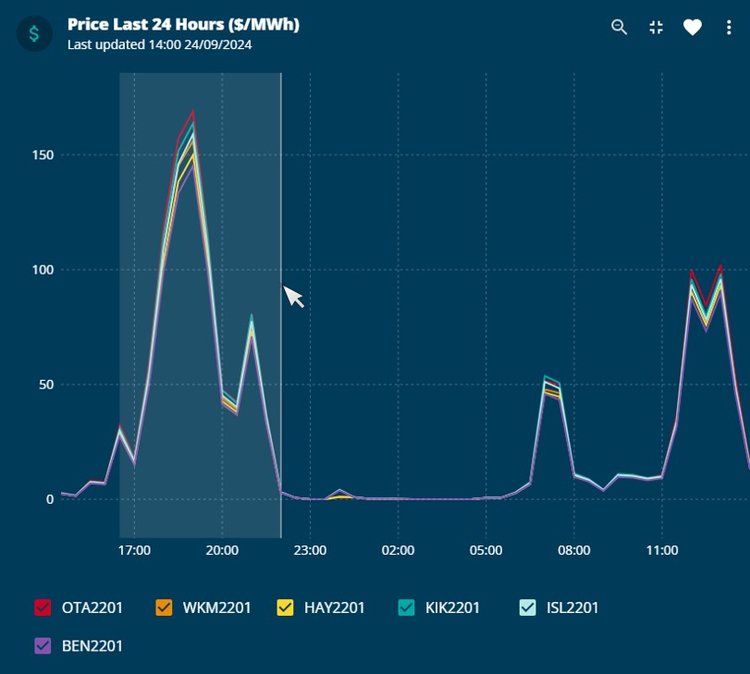
- Prices by key nodes over the past 24 hours
- Carbon emissions and renewable energy indicators
- North Island Wind Generation Forecast
- Generation Quantities
The country's grid generation visualised
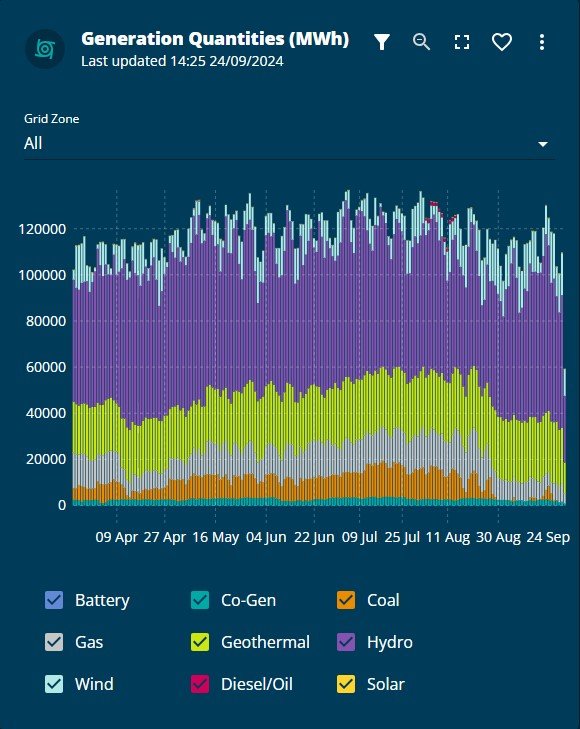
Widgets to give you the full picture of New Zealand's electricity generation make up, available to subscribers of our generation data feeds.
- Generation capacity at each generator around the country, with a snapshot view of the past seven days generation
- The last 24 hours of generation broken up by fuel type
- Six months' worth of daily generation quantities
Peak Demand and Residuals
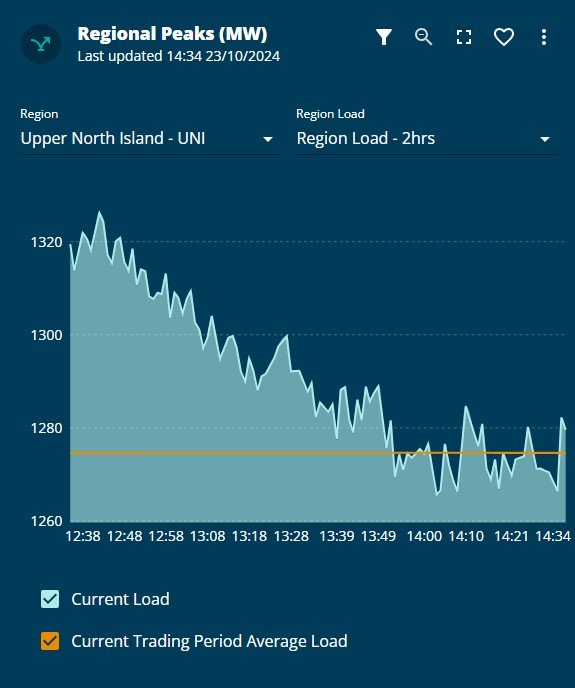
Aids to help you manage winter peaks and low residual situations, available to subscribers of our peak demand data feeds.
- Residuals widget with residual generation information for New Zealand and North and South Islands, with wind risk overlay
- Data visualised for NRS, PRS, RTD and WDS schedules
- Regional Peaks widget with comparison to yesterday's activity and metered data
- The year's top regional peaks
Trading
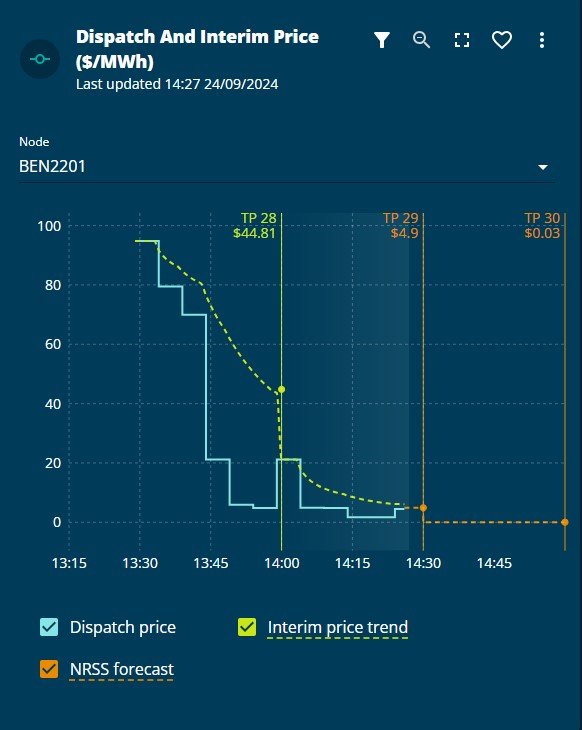
Stay on top of market trends and movements with our Trading widgets, available to subscribers of our market price data feeds.
- Dispatch and interim price graph showing trends and forecasts
- Predicted load with iterations of long forecast against actual load showing changes in expected demand
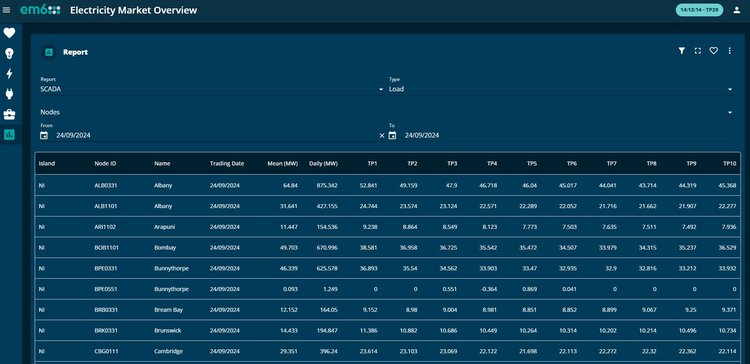
Downloadable reports
Customisable reports with handy data-preview feature and easily downloadable in CSV format straight from our website. Access different raw data depending on your subscription.
- SCADA load
- Prices
- Reserves
- Arc Flow
- Carbon emissions
Available report types depend on the package and data feeds you subscribe to.
Features to drill into the data
Simple-to-use features to help you get the most out of em6.
- Add the widgets you need the most to your own Favourites dashboard
- Select data to zoom in by clicking and dragging your mouse cursor
- Select or deselect the data shown using the tick boxes on each widget's legend
- Go big with the full screen option